
Model Ouput
The WLDAS dataset has been put on GES DISC. This is the preferred way to access this dataset.
Model output is available at NCCS Dataportal.
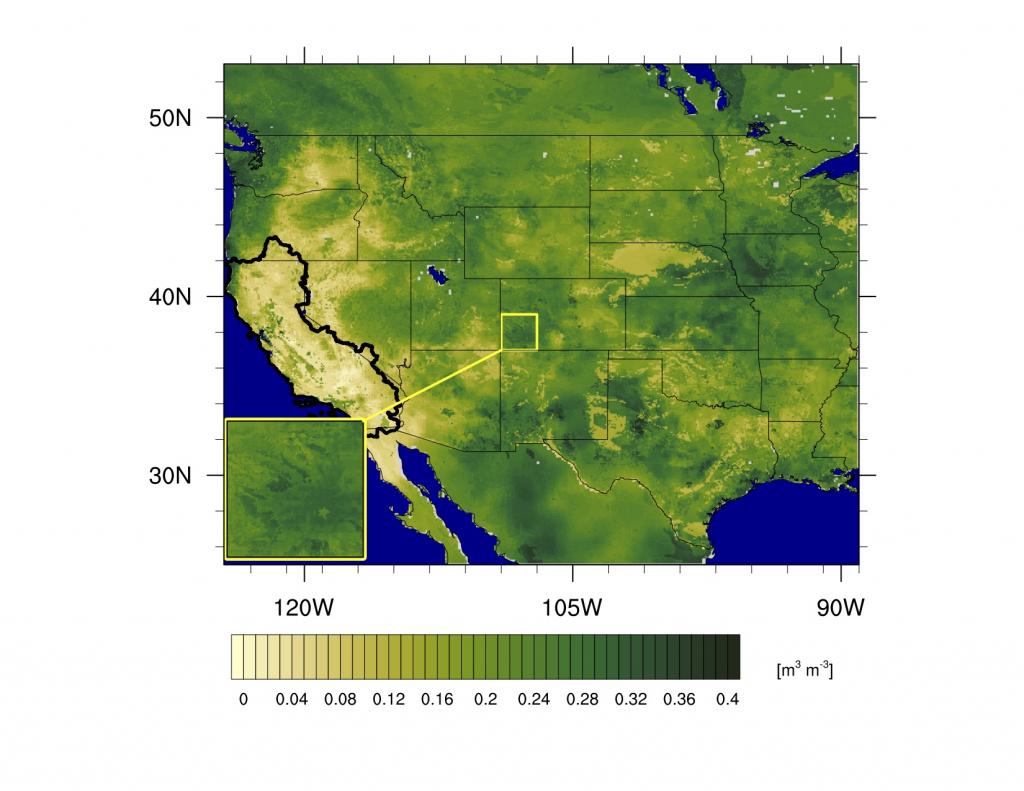
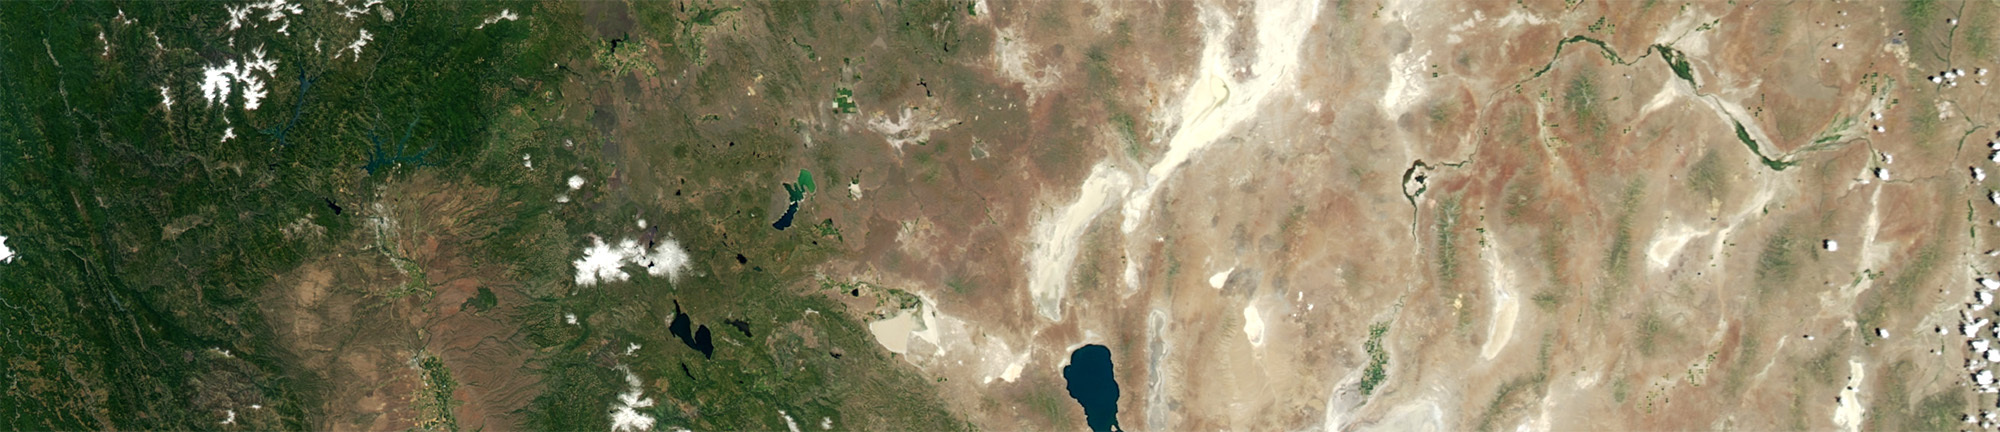
Figure 1: Simulated daily surface (0-10 cm) soil moisture at 00Z on 25 September 2014 over the WLDAS domain. The inset map highlights the 1 km grid spacing of WLDAS products.
The files are organized into monthly folders with format YYYYMM/
Within each folder, daily files are contained with format
LIS_HIST_YYYYMMDD_HHmm.d01.nc
Where YYYY is the 4-digit year, MM is the two-digit month, DD is the two-digit day, HH is the two-digit hour, and mm is the two-digit minute. Times are in Coordinated Universal Time (UTC). For example, a file with the time stamp 20200910_0000 represents the 24-hour period ending at 0000 UTC on 10 September 2020.
Each netCDF file contains the variables below.
Table 2: Daily average output of the following variables is provided by WLDAS on a 0.01°x0.01° grid. Bolded fields denote that the variable is available at multiple soil levels (0-10 cm, 10-40 cm, 40-100 cm, and 100-200 cm below the surface). Variables with _f_ denote forcing data.
| Variable | Short Name | Units |
|---|---|---|
| Soil Moisture | SoilMoist_tavg | m3 m-3 |
| Soil Temperature | SoilTemp_tavg | K |
| Snowmelt | Qsm_tavg | kg m-2 s-1 |
| Snow Water Equivalent | SWE_tavg | kg m-2 s-1 |
| Snow Depth | SnowDepth_tavg | m |
| Snow Sublimation | SubSnow_tavg | kg m-2 s-1 |
| Surface Snow Area Fraction | SnowCover_tavg | - |
| Total Evapotranspiration | Evap_tavg | kg m-2 s-1 |
| Interception Evaporation | ECanop_tavg | kg m-2 s-1 |
| Vegetation Transpiration | TVeg_tavg | kg m-2 s-1 |
| Bare Soil Evaporation | ESoil_tavg | kg m-2 s-1 |
| Total Canopy Water Storage | CanopInt_tavg | kg m-2 s-1 |
| Surface Runoff Amount | Qs_tavg | kg m-2 s-1 |
| Subsurface Runoff Amount | Qsb_tavg | kg m-2 s-1 |
| Surface Net Downward Longwave Flux | Lwnet_tavg | W m-2 |
| Surface Net Downward Shortwave Flux | Swnet_tavg | W m-2 |
| Surface Upward Latent Heat Flux | Qle_tavg | W m-2 |
| Surface Upward Sensible Heat Flux | Qh_tavg | W m-2 |
| Downward Heat Flux in Soil | Qg_tavg | W m-2 |
| Snowfall Rate | Snowf_tavg | kg m-2 s-1 |
| Precipitation Rate | Rainf_tavg | kg m-2 s-1 |
| Canopy Temperature | VegT_tavg | K |
| Bare Soil Temperature | BareSoilT_tavg | K |
| Surface Temperature | AvgSurfT_tavg | K |
| Surface Radiative Temperature | RadT_tavg | K |
| Water Table Depth | WaterTableD_tavg | m |
| Terrestrial Water Storage | TWS_tavg | mm |
| Groundwater Storage | GWS_tavg | mm |
| Wind Speed | Wind_f_tavg | m s-1 |
| Rainfall Flux (Rain + Snow) | Rainf_f_tavg | kg m-2 s-1 |
| Air Temperature | Tair_f_tavg | K |
| Specific Humidity | Qair_f_tavg | kg kg-1 |
| Surface Pressure | Psurf_f_tavg | Pa |
| Surface Downwelling Shortwave Flux in Air | SWdown_f_tavg | W m-2 |
| Surface Downwelling Longwave Flux in Air | LWdown_f_tavg | W m-2 |
| Water in Aquifer and Saturated Soil | WT_tavg | mm |
| Latitude | lat | Degrees north |
| Longitude | lon | Degrees east |